UK Guide to Business Analytics and Intelligence
UK Guide to Business Analytics and Intelligence
In today's competitive UK market, trying to run a business on gut feelings alone is a bit like sailing in a storm without a compass. You might get lucky, but you're far more likely to end up on the rocks. Business analytics and intelligence are the essential navigation tools for any modern company, working together to turn raw data into a real competitive advantage.
To put it simply, Business Intelligence tells you where you are right now, while Business Analytics helps you plot the best course forward.
Why Data-Driven Decisions Are a Must for UK Businesses
 Making strategic choices without solid data is a huge gamble. The businesses leading the pack today aren't just collecting information; they're actively interpreting it to understand their performance, see market shifts before they happen, and innovate faster than everyone else. This is where business analytics and intelligence come into their own.
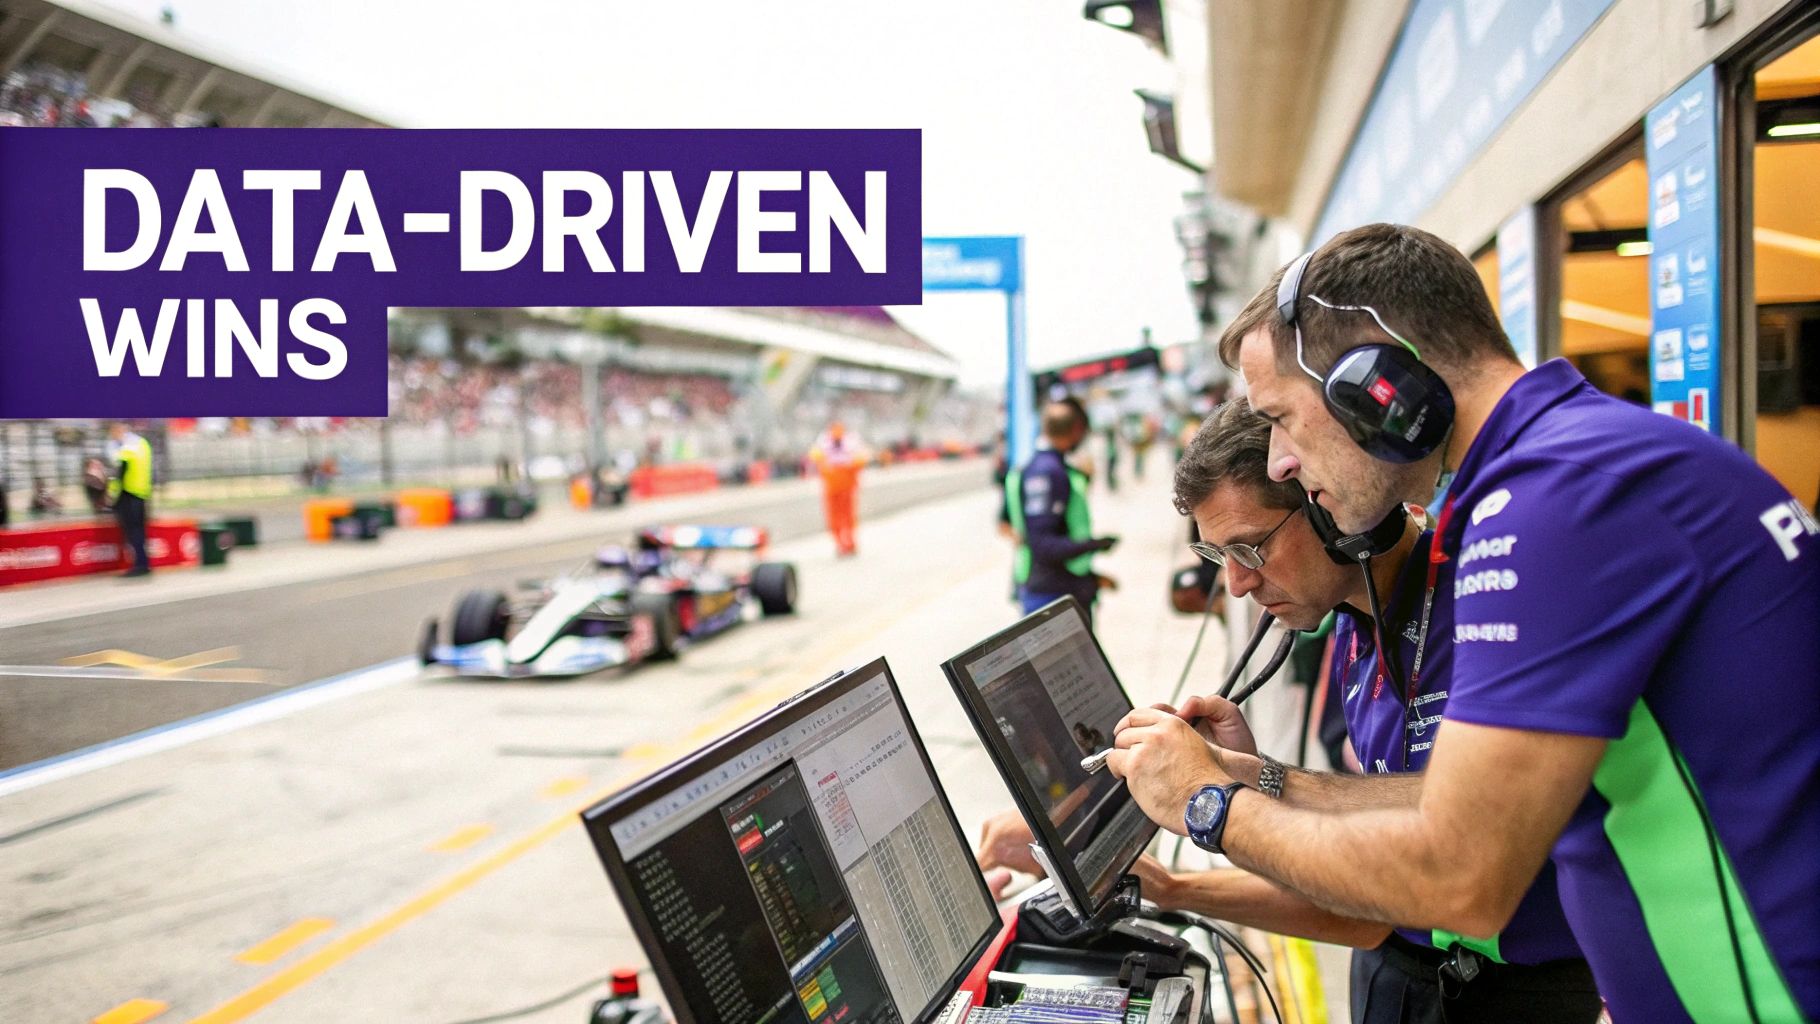
Think of it like a Formula 1 team. The car is covered in sensors, generating thousands of data points every single second. This constant stream of information feeds two distinct but deeply connected functions that are absolutely critical to winning the race.
The Role of Business Intelligence
Business Intelligence (BI) is the team in the pit garage, glued to the real-time dashboards. They’re watching the car's current speed, tyre wear, fuel consumption, and engine temperature.
BI answers the crucial question: "What is happening right now?" It gives them a crystal-clear, immediate picture of the current situation on the track. Without this, the team would be flying blind, reacting too slowly to problems or missing golden opportunities to get ahead.
The Power of Business Analytics
Business Analytics (BA), on the other hand, is the race strategist poring over predictive models. They use historical data and current performance metrics to answer the all-important question: "What should we do next?"
Based on the data, they can predict the perfect moment for a pit stop, forecast how a change in weather will affect lap times, or decide if pushing the engine harder is a calculated risk worth taking. This foresight is what allows the team to make proactive decisions that create a winning edge.
For any UK business, from a new startup to an established enterprise, combining BI and BA means you're not just a participant in the market—you're actively shaping your own path through it with calculated, intelligent actions.
This dual approach is especially powerful for companies with mobile apps. High-performance applications, like those built with Flutter, are incredibly rich sources of user data. This data provides the fuel for both your real-time dashboards (BI) and your predictive strategies (BA), turning your app from a simple tool into a core driver of business growth and insight. Making sense of this information is no longer a luxury; it's fundamental to survival.
Understanding Business Intelligence: What Happened and Why?

Think of Business Intelligence, or BI, as your company's high-tech rear-view mirror and real-time dashboard all rolled into one. At its core, BI is all about the past and the present. It delivers a clear, factual story of your operations, answering the fundamental questions: "what happened?" and "why did it happen?"
It’s a bit like a sports team reviewing the game tape after a big match. The replay shows you exactly which plays worked, who the star performers were, and where you fumbled the ball. BI does the same for your business, using hard data to paint an accurate, unvarnished picture of your performance.
The Core of Descriptive Analytics
The engine running Business Intelligence is descriptive analytics. This practice is all about taking historical data, making sense of it, and presenting it in a format that’s actually useful. It isn't trying to predict the future; its job is to give you a crystal-clear understanding of what's already happened and where you stand right now.
This historical context is the foundation of any solid business strategy. After all, trying to plan your next move without knowing how you got here is just guesswork.
BI platforms are built to answer the specific, concrete questions that leaders ask every day. These aren't abstract, philosophical queries—they are direct, practical questions that shape immediate actions and steer long-term planning.
Here are a few common questions that Business Intelligence helps answer:
- Sales Performance: What were our total sales last quarter, and how does that stack up against the same period last year?
- Marketing Effectiveness: Which digital marketing campaign brought in the most leads this month?
- Operational Efficiency: Which product lines are seeing the highest return rates, and are they concentrated in specific regions?
- Customer Behaviour: Who are our top 10% of customers based on lifetime value?
By delivering straight answers to questions like these, BI empowers managers to monitor Key Performance Indicators (KPIs), spot trends as they emerge, and get to grips with the finer details of their business.
Before we dive into the nitty-gritty of Business Analytics, let's put these two disciplines side-by-side. The following table breaks down their core functions and strategic focus, giving you a quick reference for how they differ and complement each other.
Comparing Business Intelligence and Business Analytics
| Aspect | Business Intelligence (BI) | Business Analytics (BA) |
|---|---|---|
| Primary Focus | What happened? (Past & Present) | Why did it happen and what will happen next? (Future) |
| Core Function | Descriptive Analytics (Summarising data) | Predictive & Prescriptive Analytics (Forecasting) |
| Key Questions | "How many units did we sell?" "Which region was most profitable?" | "What will sales look like next quarter?" "What's the best action to take?" |
| Data Type | Structured, historical data | Structured and unstructured data, statistical models |
| Tools & Methods | Dashboards, reports, data visualisation | Data mining, predictive modelling, machine learning |
| Output | Easy-to-understand reports and KPIs | Forecasts, statistical models, and recommendations |
| Goal | Provide a clear view of current and past performance | Identify future trends and suggest strategic actions |
This table neatly shows that while BI gives you the "what," BA provides the "what if" and "what's next," making them a powerful duo when used together.
Visualisation and Reporting: The Tools of BI
The real magic of BI is its ability to take mountains of raw, complex data and turn it into something you can understand at a glance. Instead of getting lost in endless spreadsheets, decision-makers can look at a dashboard and instantly get the lay of the land.
Business Intelligence provides the situational awareness every business needs. It’s about having a clear, data-backed understanding of your current position before you even think about charting a course for the future.
This clarity is delivered through a few key tools:
- Interactive Dashboards: A live, at-a-glance view of your most important metrics, often with the ability to click and drill down for more detail.
- Automated Reports: Regular updates on sales, marketing, or operations can be automatically generated and sent to the right people.
- Data Visualisations: Charts, graphs, and maps that make it easy to spot patterns and outliers that might otherwise fly under the radar.
These tools are essential for telling a compelling story with your data, turning numbers into a narrative that everyone in the organisation can get behind. Of course, this all relies on connecting different data sources effectively, a process our guide on what is API integration covers in more detail.
The business intelligence market in the UK is growing fast, with a projected compound annual growth rate of 9.2% between 2025 and 2030. This boom is being fuelled by the rise of IoT technologies and powerful analytics tools from big names like Microsoft and IBM.
Exploring Business Analytics: What Happens Next?
If Business Intelligence (BI) is your detailed rearview mirror, showing you where you’ve been, then Business Analytics (BA) is your smart sat-nav for the road ahead. It doesn’t just show you the map; it forecasts the traffic, suggests the quickest route, and recalculates when conditions change on the ground.
This is where we make the critical jump from hindsight to foresight. Business analytics isn't content with just describing the past. It's all about predicting the future and, crucially, prescribing the best way forward. It tackles the two most powerful questions a business can ask: "What's likely to happen?" and "So, what should we do about it?"
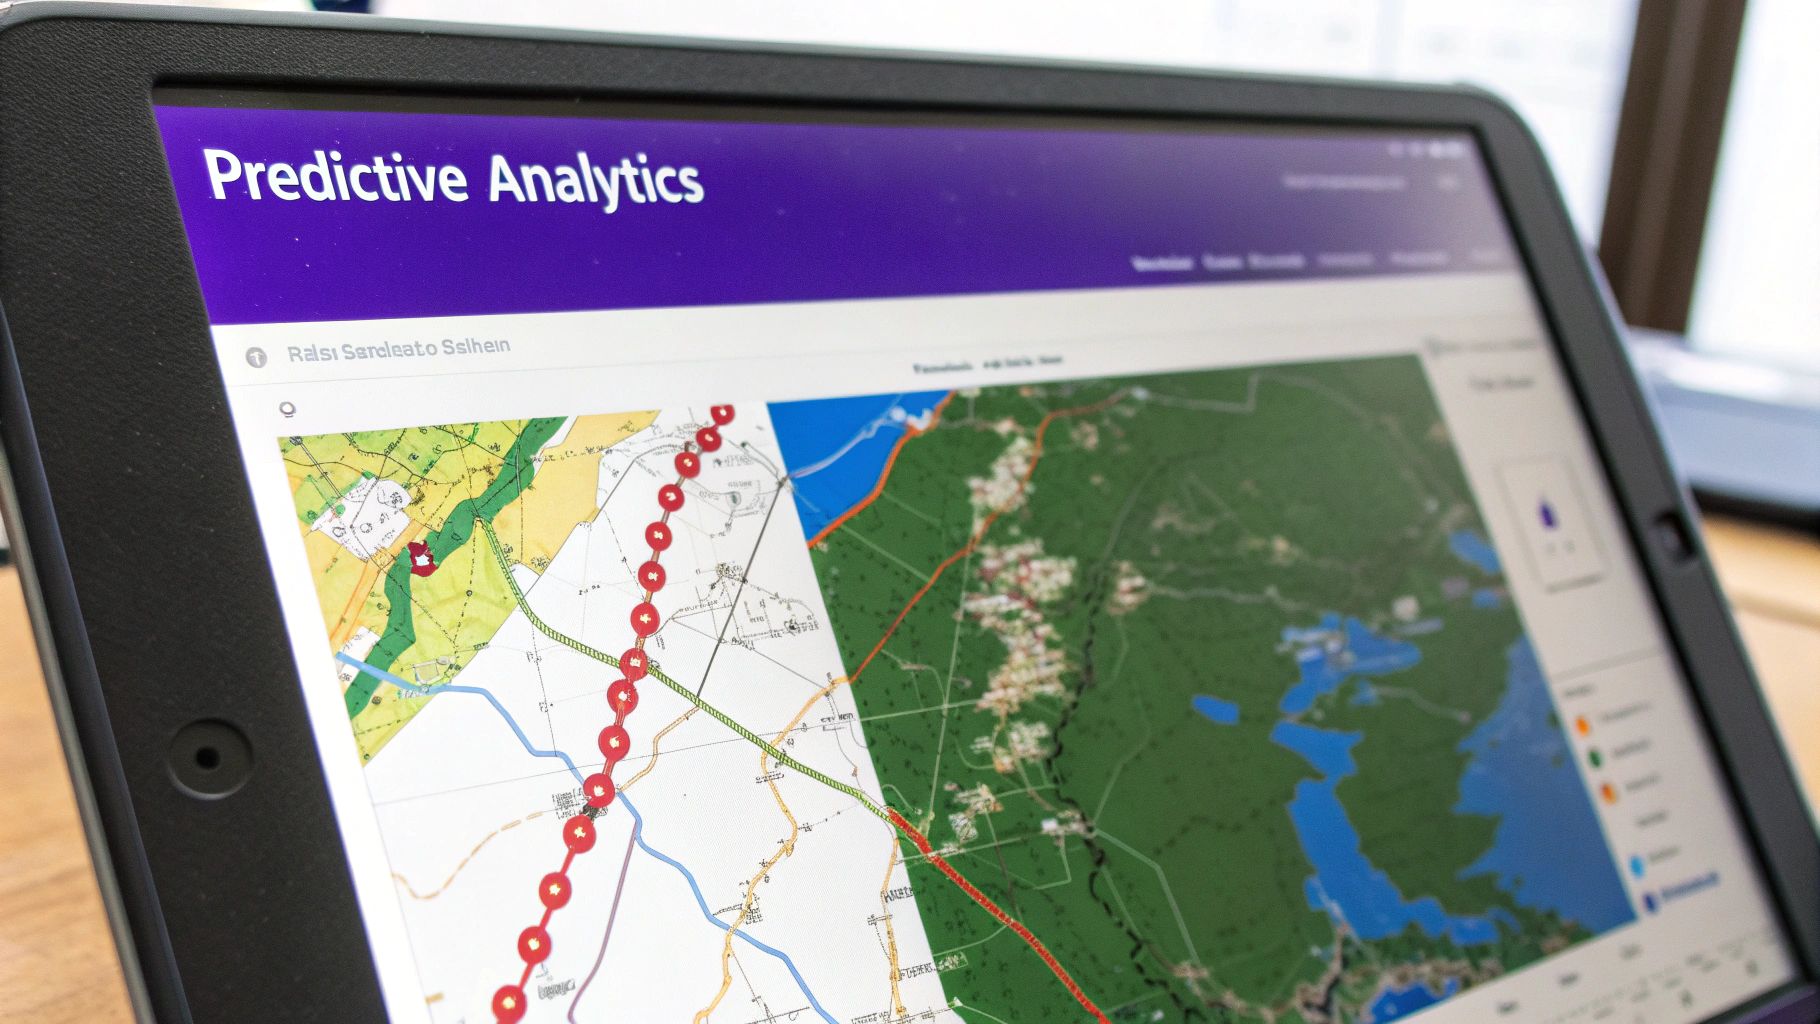
Predictive Analytics: Forecasting the Future
The first major piece of the business analytics puzzle is predictive analytics. This is where sophisticated statistical models, algorithms, and machine learning techniques get to work, digging through historical and current data to unearth hidden patterns and relationships. The end goal? To forecast future events with a high degree of confidence.
Think about a modern retail app. Predictive analytics is the magic that lets it analyse your browsing history, past purchases, and even the time of day you’re most active. From all that data, it can generate eerily accurate product recommendations, essentially forecasting what you’re most likely to buy next.
This forward-thinking approach is a game-changer across the board:
- E-commerce: Forecasting exactly how much stock you'll need for the Christmas rush, avoiding empty shelves or a warehouse full of unsold goods.
- Fintech: Spotting transaction patterns that scream "fraud," allowing companies to shut it down before the damage is done.
- Healthcare: Predicting which patients are at a higher risk of readmission based on their medical history and treatment plans.
The demand for this kind of crystal-ball capability is reshaping the data market. Within the broader context of data analytics in the UK, predictive analytics has become the largest segment, pulling in a revenue share of 39.31%. This market is set to explode from USD 4.6 billion to nearly USD 17 billion by 2030, showing just how central it's become to modern strategy. You can explore more about these market trends and what they mean for UK businesses.
Prescriptive Analytics: Recommending the Best Action
Predicting the future is one thing, but knowing what to do with that prediction is where the real competitive advantage is found. This is the domain of prescriptive analytics, the most advanced form of BA. It takes the "what will happen" from predictive models and recommends specific actions to get the best possible outcome.
So, if predictive analytics forecasts a 20% spike in customer churn next quarter, prescriptive analytics would recommend the optimal response. It might suggest offering a specific discount to the most at-risk customers or launching a highly targeted re-engagement campaign to win them back.
Prescriptive analytics is about moving from passive insight to active intervention. It doesn't just flag a potential problem; it hands you a data-backed plan to solve it.
This capability empowers businesses to get on the front foot. Instead of waiting for a problem to hit and then scrambling for a solution, organisations can see challenges coming and put countermeasures in place before they ever affect the bottom line. It helps optimise everything from pricing strategies and supply chains to marketing budgets, ensuring maximum return. Ultimately, it’s the engine that drives genuine strategic innovation, helping companies sidestep risks and seize new opportunities with confidence.
The Four Core Processes of Data Analysis
Turning a mountain of raw data into a clear-cut strategy isn't magic; it's a structured process. Think of it like a chef crafting a gourmet meal. It’s a methodical journey that takes raw ingredients and transforms them into a beautifully presented final dish. This journey can be broken down into four core processes, each absolutely vital for turning numbers into genuine insights.
Getting your head around this end-to-end workflow is crucial. It gives you a clear blueprint for building the right infrastructure to support a solid data strategy. It makes sure every bit of information you gather has a specific role to play on the path to actionable intelligence.
Stage One: Data Sourcing and Collection
First things first, you have to get your ingredients. This is the Data Sourcing and Collection stage. For a chef, this means finding the finest, freshest produce. For a business, the ingredients are data points, pulled from a huge variety of places.
This raw data can come from just about anywhere: customer chats logged in your CRM, transaction histories from your e-commerce site, or even real-time user engagement data streaming in from your high-performance Flutter mobile app. The goal here is to cast a wide but focused net, grabbing all the information you need to answer your most important business questions.
Just remember, the quality of your final insights hangs entirely on the quality of the data you collect now. Rubbish in, rubbish out. Poor ingredients make for a disappointing meal, no matter how skilled the chef.
This infographic shows a simplified flow from that initial data gathering to generating predictive insights.
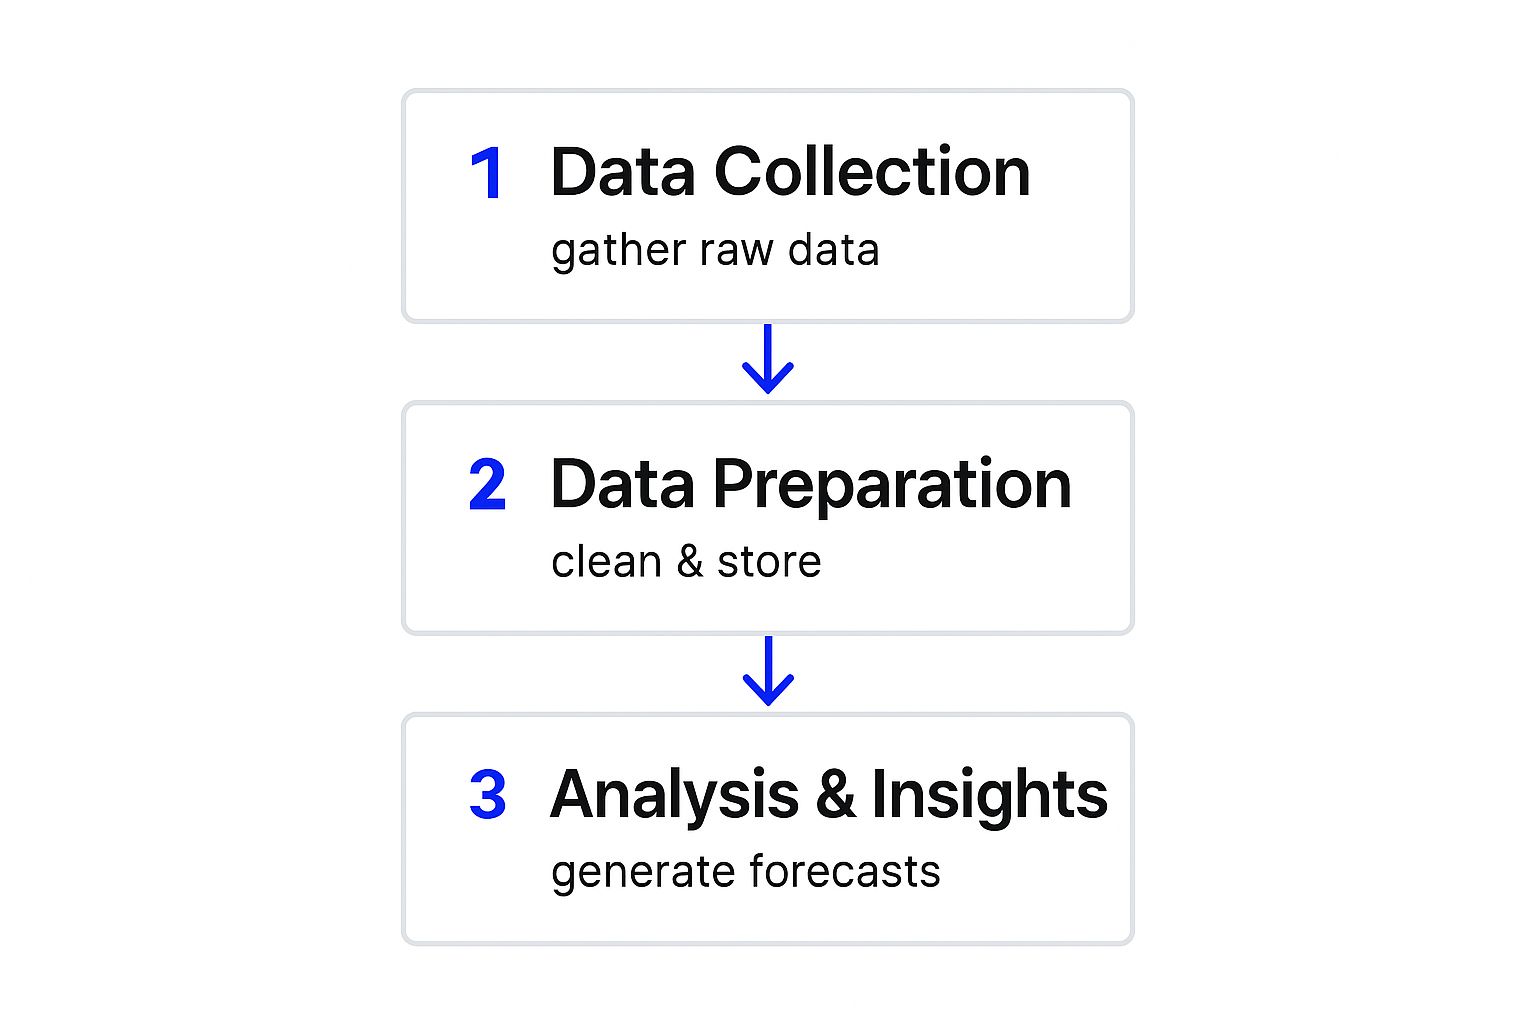
As you can see, each step builds on the last, turning messy, unstructured data into clean, organised information that’s ready for some serious analysis.
Stage Two: Data Preparation and Warehousing
Once you've got your ingredients, the prep work begins. This is the Data Preparation and Warehousing stage. It’s a critical step that often takes up the most time but is absolutely essential for getting accurate results. Raw data is almost never ready for analysis straight away; it needs to be cleaned, organised, and stored properly.
This stage involves a few key actions:
- Cleaning: Getting rid of duplicates, fixing errors, and dealing with missing values.
- Structuring: Whipping the data into a consistent, usable format.
- Storing: Putting the prepared data into a data warehouse or data lake so it's ready and accessible for analysis.
Think of it as washing vegetables, trimming the fat off a piece of meat, and getting all your prepped ingredients laid out on the counter. This meticulous organisation makes the actual cooking—the analysis—so much smoother and more reliable. Structuring data correctly is fundamental, and a great way to get a handle on it is by mastering entity relationship diagramming to visualise how all your different data points connect.
Stage Three: Data Analysis and Mining
With everything prepped and ready to go, it's time for the main event: Data Analysis and Mining. This is where the chef starts cooking, applying heat and technique to turn those ingredients into a delicious dish.
This is where both business intelligence and business analytics techniques come into play. BI tools might be used to look at historical data to figure out what happened in the past (descriptive analytics). At the same time, BA models dig deeper to spot patterns, build predictive models, and find hidden opportunities (predictive and prescriptive analytics). This is where you identify trends, make forecasts, and pull out the core insights that will drive your decisions.
Stage Four: Reporting and Visualisation
The final stage is Reporting and Visualisation. This is the chef artfully plating the finished meal. A brilliant dish can be completely let down by poor presentation, and the exact same thing is true for data insights.
Powerful insights are useless if they cannot be easily understood by the people who need to act on them. This final step is all about communication and storytelling.
This involves creating clear, compelling dashboards, charts, and reports that serve up your findings in an intuitive and digestible way. The goal is to tell a story with the data, highlighting the most important takeaways and making it easy for stakeholders to grasp the implications and make informed, confident decisions.
Choosing the Right Analytics Tools for Your Business
Picking the right tools for your business analytics and intelligence efforts is what turns a mountain of raw data into a genuine strategic advantage. The market is absolutely flooded with options, which can feel a bit much, but if you break it down into the main categories, the choice becomes a lot clearer. It’s all about matching the tech to what your business actually needs, the resources you have, and where you want to go.
For many UK businesses, the first step is just getting a solid grip on what’s happening right now. That’s where dedicated visualisation platforms really come into their own.
BI and Visualisation Platforms
Think of Business Intelligence (BI) and visualisation tools as the great translators of the data world. They’re built to make data understandable for everyone, not just the hardcore data scientists. Platforms like Microsoft Power BI and Tableau are the big names here, letting you plug into all sorts of data sources and spin up interactive dashboards in no time.
These tools are brilliant for:
- Creating those at-a-glance reports that track your most important KPIs.
- Getting a clear picture of sales trends, marketing campaign performance, and operational efficiency.
- Giving your team the power to dig into the data and answer their own questions, without needing to queue up for a technical report.
The screenshot below gives you a feel for a typical Power BI dashboard. It pulls together sales, profit, and regional performance data into one clean, interactive screen.
This kind of visual approach instantly shows you which products are flying off the shelves and which regions are lagging, turning a dense spreadsheet into something you can actually act on.
Data Analytics Languages
But what happens when you need to go deeper? When you want to move from just describing what happened to predicting what’s likely to happen next, you’ll need some custom firepower. This is where powerful programming languages like Python and R step in.
These open-source languages are the bread and butter for data scientists and analysts doing the heavy lifting. They come with vast libraries for statistics, machine learning, and data wrangling, offering pretty much unlimited flexibility to build predictive models that solve your specific business problems. For instance, a developer could use Python to build a model that flags which customers are likely to churn or forecasts demand for a new product.
While they do have a steeper learning curve, languages like Python and R give you unmatched power for deep, predictive analysis. You can build your own analytics solutions that become a serious competitive edge.
All-in-One Cloud Platforms
If you're looking for a single, scalable solution that can grow with you, the big cloud providers have you covered. Platforms from Amazon Web Services (AWS), Google Cloud, and Microsoft Azure offer the whole shebang—from data storage and warehousing to advanced AI and machine learning tools, all integrated.
These platforms are perfect for businesses on a rapid growth trajectory. You can start with simple BI dashboards and then layer on more sophisticated features like real-time data processing and predictive analytics as your needs get more complex. The integrated setup means your entire data pipeline, from collection to visualisation, just works together seamlessly.
The UK data analytics market is booming, which tells you just how vital these tools have become. Valued at around USD 3.5 billion, the market is expected to rocket to USD 25.3 billion by 2033, all thanks to the uptake of advanced tech. You can explore more about this market expansion to get a handle on the trends shaping UK business. Nailing down the right stack—whether it's a friendly BI platform, a powerful coding language, or a do-it-all cloud suite—is the first real step in making that growth work for you.
Unlocking Data Insights with High-Performance Flutter Apps
For any modern UK business, a mobile app is so much more than a digital shopfront. When built the right way, it becomes a powerful, non-stop data collection engine, feeding the very core of your business analytics and intelligence strategy. High-performance apps are the critical link between what your users do and what your business needs to know.
This is where your choice of development framework becomes a massive strategic decision. Flutter, Google's UI toolkit, has a stellar reputation not just for creating beautiful interfaces, but for its raw performance. Because Flutter apps are compiled straight to native code, they deliver a consistently smooth, fast, and reliable experience for users on both iOS and Android, all from one codebase.
Why Flutter Performance Matters for Data Quality
Fantastic app performance isn't just about keeping users happy; it’s about guaranteeing the quality of the data you collect.
Think about it: a sluggish or buggy app leads to weird user interactions and people giving up halfway through. This completely pollutes your data streams. If a user gets frustrated and force-quits during a purchase, you’ve just lost a crucial data point and skewed your sales funnel metrics.
Flutter’s consistently high performance means that data is captured reliably, every single time. This clean, high-quality data is the essential fuel for both your BI dashboards (showing what's happening right now) and your BA predictive models (forecasting what's likely to happen next). You can trust the insights because you can trust the source.
A high-performance Flutter app ensures the data flowing into your analytics platforms is accurate and complete, turning user engagement into a reliable source of business intelligence. This transforms your app from a simple user-facing tool into a core strategic asset.
Integrating Analytics into Your Flutter App
To get your hands on this valuable data, you need to integrate analytics tools directly into your app. This process is surprisingly straightforward in Flutter, which has robust support for platforms like Google's own Firebase Analytics. This integration lets you track a huge range of user interactions, from the smallest tap to the most complex journey.
Practical steps involve setting up specific event tracking to monitor key actions your users take. This builds a detailed, real-world picture of how people are actually using your application.
Common metrics you'll want to track include:
- User Engagement: How active is your user base? Keep an eye on screen views, session duration, and how often people open the app.
- Feature Adoption: Are people using that new feature you just launched? Tracking interactions helps you judge its success and decide where to focus your development efforts next.
- Conversion Funnels: Map the entire user journey from discovering a product to finalising a purchase. This lets you pinpoint exactly where users might be dropping off.
This app-generated data feeds directly into your analysis, helping you reduce user churn, personalise experiences with targeted content, and make properly informed decisions on future updates. It's a continuous loop of data collection and analysis, and optimising your development pipeline is key. For a deeper look into streamlining this process, you can learn more about what is continuous integration for Flutter apps and how it supports a data-driven development cycle.
By connecting a high-performance Flutter app to a robust analytics backend, you turn every single user tap and swipe into a valuable piece of intelligence.
Frequently Asked Questions
Getting your head around business analytics and intelligence can throw up a lot of questions, especially if you’re a UK business just starting to explore what’s possible. Here are a few clear, straightforward answers to the questions we hear most often, designed to help you get from theory to action.
What Is the Main Difference Between BI and BA?
The easiest way to think about it is comparing a rearview mirror to a sat-nav.
Business Intelligence (BI) is your rearview mirror. It looks at historical and current data to give you a crystal-clear picture of what's already happened and what's going on right now. It's all about descriptive analytics—understanding your performance to date.
Business Analytics (BA), on the other hand, is your sat-nav. It’s forward-looking, using predictive models to forecast what's likely to happen next and even suggesting the best route forward. Just like a sat-nav warns you about traffic ahead and finds a quicker way, BA helps you anticipate challenges and opportunities.
How Can a Small Business Start with Analytics?
The key is to start small. You don't need to jump in with a massive, all-singing, all-dancing system from day one.
Begin by picking one or two really important business questions you need answers to. Maybe it's, "Who are our most profitable customers?" or "Which marketing channel is actually giving us the best return on investment?"
Once you have your questions, you can:
- Use the tools you already have: Most CRMs and accounting software packages have their own reporting features built-in. Start there. It’s a great way to get a feel for your data without any extra cost.
- Focus on a few key metrics: Don't get overwhelmed by trying to track everything at once. Pick a handful of Key Performance Indicators (KPIs) that directly tie back to your main business goals.
- Try an entry-level BI tool: Platforms like Microsoft Power BI have free or very affordable plans that are perfect for getting started with data visualisation and making your numbers tell a story.
The real goal here is to build momentum. Start with simple descriptive analytics to get a better handle on your business. As you get more comfortable and your data grows, you can start exploring more advanced predictive stuff.
Are Analytics Only for Tech Companies?
Not at all. That’s a common misconception. While tech firms were definitely early adopters, analytics and BI are now making a huge difference in every single sector across the UK.
Think about it: a construction company can use analytics to fine-tune its supply chain and predict project delays. A local retailer can forecast demand for certain products, and a healthcare provider can analyse patient outcomes to improve the quality of care.
If your organisation generates data—and let's be honest, pretty much every business does these days—then you can benefit. The core idea of turning raw data into smart decisions is universal. For any business with a mobile app, a high-performance Flutter app can be a goldmine of data. And with new benchmarks showing Flutter leading in performance, you can be confident the data you’re collecting is both reliable and lightning-fast.
Ready to turn your app into a powerful data engine? App Developer UK specialises in building high-performance Flutter applications that provide the clean, reliable data needed to fuel your business analytics and intelligence strategy. Let's build your data-driven future together.