What Is the ERD? Essential Guide to Database Blueprints
What Is the ERD? Essential Guide to Database Blueprints
Ever heard the saying, "measure twice, cut once"? In the world of app development, an Entity Relationship Diagram (ERD) is how you measure. It’s the visual blueprint that lays out the entire structure of your database before a single line of code gets written.
Think of it as the architectural plan for your application's data foundation. It shows you what data you're storing, the details about that data, and—most importantly—how all the different pieces connect.
Your Blueprint for Building a Solid Database

You wouldn't build a house without a plan, would you? You’d risk ending up with doors that open into walls or a kitchen with no plumbing. Building an app without a clear data plan is just as chaotic. Information gets lost, features break, and trying to scale up later becomes a nightmare.
This is precisely the problem an ERD solves.
So, what is an ERD in simple terms? It's a flowchart-style diagram that maps out your database's core components. It acts as a common language, letting developers, project managers, and even non-technical stakeholders agree on the data structure from the very beginning.
The Foundation of Logical App Development
For any high-performance application—especially those built with powerful frameworks like Flutter—a well-designed database isn't just nice to have; it's essential. An ERD brings the clarity you need to build that foundation correctly from day one. It forces you to think through and organise your data logically.
At its core, the diagram defines three key elements:
- Entities: The main things you need to store information about, like 'Customers' or 'Products'.
- Attributes: The specific details of each entity, such as a customer's
nameor a product'sprice. - Relationships: How different entities connect and interact. For instance, a 'Customer' buys a 'Product'.
Let's break down these building blocks. The table below shows how each component translates from a high-level blueprint idea into a concrete database role.
ERD Components at a Glance
| Component | Blueprint Analogy | Database Role |
|---|---|---|
| Entity | A room in the house (e.g., "Kitchen") | A table in the database (e.g., Users) |
| Attribute | A feature of that room (e.g., "Oven") | A column in a table (e.g., user_email) |
| Relationship | A hallway connecting two rooms | The link between two tables (e.g., a foreign key) |
By seeing these connections visually, an ERD helps everyone on the team understand the data's logic and flow.
By mapping these components out, an ERD turns abstract business rules into a solid, technical plan. It becomes the single source of truth for your data, cutting out confusion and making sure everyone on the project is on the same page.
This upfront planning is absolutely vital. It ensures the database you build is not only efficient and logical but also scalable enough to handle your app's future growth. For a closer look at the process, our guide on creating Entity Relationship Diagrams that work offers more practical tips.
The Three Core Building Blocks of Every ERD
To really get your head around what an ERD is, you need to understand its three fundamental components. Think of them as the nouns, adjectives, and verbs of your database's language. Once you get these down, you can deconstruct any database plan and start sketching your own with confidence.
Let's break these building blocks down using a familiar example: an e-commerce app.
Entities: The Nouns of Your System
First up, and most importantly, we have Entities. These are the main objects or concepts—the "things"—that your application needs to keep track of. In our e-commerce app, the obvious entities would be Customer, Product, and Order.
Each entity represents a distinct object that can be uniquely identified, and they eventually become the main tables in your database. Nailing down the right entities is the critical first step. It's how you build a logical data structure that actually reflects how your business works.
This infographic shows how entities are the starting point, with attributes adding detail and relationships creating the connections.
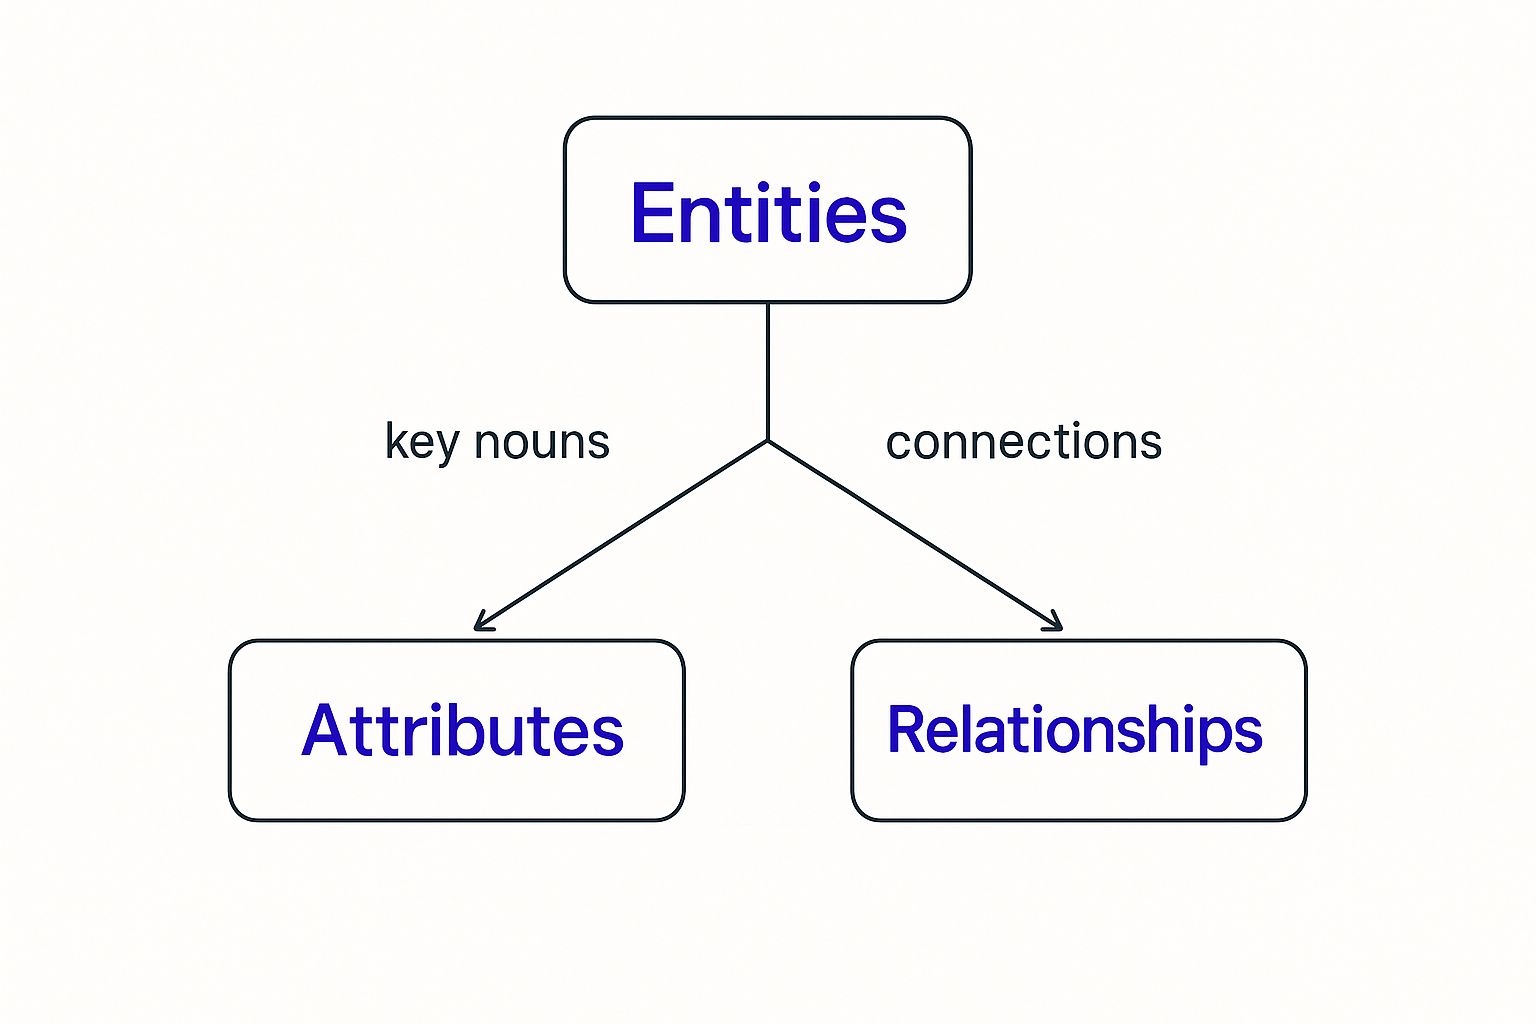
As you can see, entities are central. They're the foundation that the rest of the diagram is built upon.
Attributes: The Adjectives That Add Detail
Once you’ve figured out your entities, you need to define their Attributes. These are the properties or characteristics that describe each entity, a lot like how adjectives describe a noun. They're the specific pieces of information you want to collect.
For instance, a Customer entity would have attributes like:
customer_id(a unique identifier)first_namelast_nameemail_addressshipping_address
Likewise, a Product entity might have attributes like product_name, price, and stock_quantity. These attributes become the columns in your database tables, holding the actual data for each record. Defining them clearly from the start ensures you capture everything your app needs to function properly.
An entity without attributes is just an empty concept. Attributes give entities substance and meaning, turning an abstract idea like "Customer" into a concrete record with specific, usable information.
Relationships: The Verbs That Connect Everything
Finally, we have Relationships. These are the associations between entities. They're the "verbs" that describe how entities interact with one another, bringing your whole data model to life. For a deeper look at this, you can check out a dev's guide to creating ER diagram designs for more advanced techniques.
Relationships show the logical connections that exist in the real world. In our e-commerce example, a Customer places an Order, and an Order contains a Product. These connections are what turn a bunch of isolated data tables into a cohesive, powerful system. Next, we'll get into the rules that govern these connections.
Defining the Rules with Relationships and Cardinality

So, we've got our entities and their attributes. That's a great start, but it's a bit like having a list of nouns and adjectives. The real magic happens when we start connecting them with verbs—and that's where relationships and cardinality come in.
These two concepts define the rules of engagement between your data. They turn a static collection of tables into a dynamic system with its own internal logic, ensuring everything interacts just as it would in the real world.
Think of it this way: cardinality sets the numerical boundaries for every relationship. It answers crucial questions like, "How many orders can one customer have?" Getting these rules right from the start is absolutely essential for building a database that works, preventing messy data problems down the road.
Understanding Relationship Types
The connections between entities aren't all the same. They typically fall into one of three main categories, and these rules are what make your database smart. They ensure data is stored logically, preventing chaos.
- One-to-One (1:1): This is the most straightforward relationship. One instance of an entity is linked to exactly one instance of another. A classic example is a person and their passport—one person has only one passport, and that specific passport belongs only to them.
- One-to-Many (1:N): You'll see this one everywhere; it's the most common type of relationship. It means one record in a table can be associated with many records in another. For instance, one
Customercan place manyOrders, but eachOrderis tied back to just oneCustomer. - Many-to-Many (M:N): This happens when many records in one table can relate to many records in another. A university is the perfect example: a
Studentcan enrol in manyClasses, and eachClasscan contain manyStudents.
These relationship types form the backbone of your ERD's logic. They're the first step in ensuring your database structure actually makes sense.
What Is Cardinality in an ERD?
If relationship types are the general rules, cardinality is where we get specific. It defines the exact minimum and maximum number of connections allowed between entities. It uses a specific notation to show these constraints visually, which is critical for turning the diagram into a physical database.
Let's go back to our Author and Book example. A one-to-many relationship is a good start, but cardinality makes it precise. We might set a rule that an author must write a minimum of one book and a maximum of many, while a book must have exactly one author.
These fine-tuned rules are what prevent "orphaned" records (like a book with no author) and keep the entire database consistent and reliable.
Cardinality is the grammar of your database. It provides the strict rules that ensure relationships are not just connected, but connected in a way that makes sense and reflects the operational logic of your business.
This level of detail is what transforms a simple sketch into a powerful blueprint for a solid, error-free database—something that's absolutely vital for the robust Flutter applications we build. The symbols on the connecting lines aren't just for show; they dictate the precise rules of interaction, ensuring the final system behaves exactly as you expect.
Choosing Your Visual Language: Chen vs. Crow's Foot
When you start sketching out or reading an Entity Relationship Diagram, you'll notice pretty quickly that they don't all look the same. There are a few different visual styles, known as notations, that people use to map out database logic. Think of them as two dialects of the same language—they communicate the exact same ideas, just with different symbols.
The two you'll bump into most often are Chen and Crow's Foot. Getting a handle on both is crucial for reading any ERD you come across and for picking the right visual style for your own projects.
The Conceptual Clarity of Chen Notation
Developed way back in 1976 by a computer scientist named Peter Chen, this notation is one of the originals and has a more academic feel. Its biggest strength is its incredible conceptual detail. It uses very specific shapes for different parts of the diagram, making the structure pop right off the page.
With Chen notation:
- Entities get their own rectangles.
- Attributes are placed inside ovals.
- Relationships are shown using diamond shapes.
This clear separation makes it fantastic for high-level modelling and those early brainstorming sessions. When your main goal is to thrash out business logic and make sure everyone—from developers to project managers—is on the same page, Chen’s explicit style is a lifesaver. It really forces you to think through each component one by one.
Chen notation shines at the conceptual level. Its distinct, deliberate symbols make it a brilliant tool for initial database design and for explaining complex ideas to a non-technical audience.
The Modern Efficiency of Crow's Foot
Chen notation is brilliant for planning, but in the trenches of modern software development, you’ll find Crow's Foot is far more common. It's popular for a reason: it's more compact and intuitive, which means you can draw it faster and read it more easily once you know what you're looking at.
Crow's Foot simplifies things by putting entities and their attributes together in a single box, listing the attributes right under the entity's name. The real magic, though, is how it handles relationships and cardinality. It uses simple lines with symbols on the end that look a bit like a crow's foot to show a "many" connection, while a straight line or a circle indicates "one" or "zero."
Comparing Chen and Crow's Foot Notations
So, which one should you use? It often comes down to personal preference or what your team is used to. Here's a side-by-side look at the two most popular ERD notations to help you decide which fits your needs.
| Aspect | Chen Notation | Crow's Foot Notation |
|---|---|---|
| Visual Style | Uses distinct shapes for entities, attributes, and relationships. | More compact, using boxes for entities and attributes together. |
| Best For | High-level conceptual design and academic purposes. | Practical application development and software documentation. |
| Learning Curve | More symbols to learn, but visually very clear. | Fewer symbols to learn, making it faster to use day-to-day. |
Ultimately, the choice depends on your team and where you are in the project. For building high-performance Flutter apps, most UK developers will be working with tools that default to Crow's Foot. It's just faster and more practical for defining a clear answer to the question, "what is the ERD" structure you need to get building.
Why ERDs Are a Developer's Best Friend

So, enough with the theory. Let’s get into why ERDs are so critical in the real world. For any development team, especially those building high-performance Flutter apps here in the UK, a solid Entity Relationship Diagram isn't just a nice-to-have; it's a must. New benchmarks put Flutter at the top for performance, and a well-designed database is the engine that drives that speed.
Think of an ERD as the single source of truth for your project’s data. It gets everyone—developers, DBAs, project managers—on the same page, creating a shared language that stamps out miscommunication and costly rework later on. It’s what turns abstract business rules into a concrete, visual blueprint that the entire team can rally around.
The Foundation for Scalable Applications
In today's market, if your app can't scale, it won't survive. An ERD is your first, and most important, step towards building a database that can handle growth. By mapping out how everything connects from the very beginning, you can spot potential bottlenecks and design a clean, logical structure right from the start.
This kind of proactive planning is absolutely vital for complex systems. Just look at the enterprise resource planning (ERP) market in the United Kingdom. It’s expected to explode from USD 4.5 billion in 2024 to a massive USD 12 billion by 2035. That growth is all about the need for tightly integrated data in businesses that are only getting more complex, which shines a spotlight on just how crucial good database planning is. You can read more about the rising investment in UK ERP systems and see the trend for yourself.
A well-crafted ERD doesn’t just document your database; it stress-tests the logic behind it. This initial planning phase is the cheapest and easiest place to fix structural problems—long before they become expensive coding nightmares.
Streamlining Development and Maintenance
A clear ERD delivers practical benefits that save a huge amount of time and stress throughout the project. It’s a tool that keeps on giving, long after the initial whiteboard sessions are over.
Here are a few ways an ERD makes life easier:
- Faster Troubleshooting: When a data-related bug pops up, the ERD is your treasure map. Developers can instantly trace relationships and pinpoint the problem’s source without having to trawl through thousands of lines of code.
- Simplified Onboarding: A new developer can get their head in the game much faster by studying the ERD. It gives them a bird's-eye view of the system's architecture, dramatically cutting down their learning curve.
- Easier Maintenance: Need to add a new feature or update an old one? The ERD shows you exactly how those changes will ripple through the existing data structure, helping you avoid nasty, unforeseen side effects.
Ultimately, putting time into a thorough ERD is an investment in your app’s quality and future. For more tips on getting it just right, you might want to check out our guide on mastering entity relationship diagramming.
Your ERD Questions Answered
When you first start wrestling with Entity Relationship Diagrams, a few questions always seem to surface. Getting your head around these is the key to moving forward with confidence. Here, we'll tackle the most common queries to give you some clear, practical answers for your own projects.
One of the first hurdles is simply understanding that not all ERDs are the same. They actually evolve as a project goes from a high-level idea to a concrete, buildable database.
Logical vs Physical ERD: What Is the Difference?
The easiest way to think about this is to compare it to building a house. A logical ERD is the architect's first sketch, while a physical ERD is the builder's final, detailed construction blueprint. They both describe the same house, but they serve different purposes and have different levels of detail.
- A Logical ERD is all about the big picture. It maps out the business requirements and defines what data the system needs to hold. You’ll find the key entities, their attributes, and how they relate to one another, but you won't see anything about specific database technology. The focus is purely on the what.
- A Physical ERD gets into the technical weeds. This is where the logical plan gets translated into a specific database schema. It defines data types (like
VARCHARorINTEGER), lays out primary and foreign keys, and details all the other database-specific rules. Its job is to define how the data will be stored.
You always start with the logical model to make sure you’ve got the business rules straight. Only then do you move on to creating the physical model to actually build the database.
How Detailed Should My First ERD Be?
Keep it simple. Your first ERD should be a logical model that’s clear enough to be useful but not so complex that it gets bogged down in technicalities. Forget about data types and database engines at this stage.
Your main goal is to map out the business logic correctly. Focus on identifying the main entities, pinning down their most important attributes, and figuring out the relationships between them. This initial diagram becomes the foundation for discussion and refinement with your team.
Once everyone agrees on this high-level structure, you can start layering in more detail, which eventually leads to the creation of the physical ERD. The trick is to start broad before you narrow your focus.
What Are the Best Tools for Creating ERDs?
There are plenty of fantastic software tools out there to help you create, share, and manage your diagrams. The right one really depends on your team's workflow, technical preferences, and budget. Some of the most popular choices we see are:
- Lucidchart: A really flexible, cloud-based tool with great templates and features for team collaboration.
- dbdiagram.io: A brilliant option for developers who prefer a "diagrams as code" approach, letting you define structures by writing simple text.
- Creately: A versatile diagramming tool that comes packed with a huge library of shapes and pre-set styles.
- DrawSQL: A modern tool that helps you visualise your database schema, and it even has a gallery of real-world examples for inspiration.
Many of these offer free tiers, so you can easily try a few out to see which one feels right. As businesses grow, having the right tools for managing data becomes non-negotiable. This is reflected in the UK's growing investment in data-centric platforms; the UK ERP market generated revenues close to USD 5.27 billion in 2023 and is on track to nearly double by 2030. You can find more insights on how UK businesses are harnessing data-driven decision-making on grandviewresearch.com.
Ready to turn your app idea into a high-performance reality? At App Developer UK, we specialise in building powerful, scalable Flutter applications backed by solid database architecture. Contact us today to discuss your project.