Mastering Entity Relationship Diagramming
Mastering Entity Relationship Diagramming
Before anyone writes a single line of code for a new database, a plan is non-negotiable. That plan is entity relationship diagramming—a visual blueprint mapping out what information a system needs to store and exactly how those different pieces of information connect.
Think of it as the architectural drawing for your data.
The Blueprint for Your Database

An Entity Relationship Diagram (or ERD) is a go-to tool for developers, analysts, and database admins alike. It’s the bridge that translates messy business requirements into a logical, organised data structure, giving everyone a clear map before the first table is even created. This initial planning is absolutely vital for building software that’s not just functional, but also efficient and scalable.
By sketching out the data structure visually, teams can spot potential problems early, hash out the logic, and get everyone on the same page, from project managers to the developers deep in the code. This kind of clarity is a lifesaver on complex projects, like building a high-performance mobile app with a framework like Flutter, where a snappy user experience depends entirely on a well-designed database humming away in the background.
Why an ERD Isn’t Just a Nice-to-Have—It’s Essential
Jumping into database construction without a solid plan is a recipe for disaster. You end up with disorganised data, sluggish performance, and a mountain of costly rework down the line. Entity relationship diagramming is the antidote, helping you lay a solid foundation from day one.
So, what are the real-world wins?
- Better Communication: ERDs act as a common visual language. They cut through the jargon and bridge the gap between technical teams and business stakeholders, making sure the final database actually solves real-world problems.
- Fewer Headaches: By putting the database structure on paper first, developers can spot logical flaws and weird inconsistencies before they’re baked into the code. It’s much easier to move a box on a diagram than to refactor a live database.
- Smarter Database Design: The process itself forces you to think deeply about how data relates. This leads to a more efficient, logical, and ultimately more maintainable database that won’t buckle under pressure.
- Clear Documentation That Lasts: A good ERD is worth its weight in gold as documentation. It helps new team members get up to speed quickly and gives existing teams a reliable map to follow when planning future updates.
An ERD isn’t just a technical diagram; it's a strategic communication tool. It ensures that the database being built is not only technically sound but also perfectly aligned with the business objectives it is meant to support.
In short, entity relationship diagramming is the first and most critical step in building a robust database—one that can reliably support sophisticated applications and keep business processes running smoothly.
The Building Blocks of an ER Diagram
To get the hang of entity relationship diagramming, you first need to understand its three core components. The easiest way to think of them is as the nouns, adjectives, and verbs of your data’s language.
Every single ER diagram, no matter how ridiculously complex it might seem, is built from these fundamental pieces. They work together to create a clear, logical map of your information, turning a vague business need into a solid database blueprint. The big three are entities, attributes, and relationships.
Entities: The Nouns of Your Database
Entities are the main objects or concepts you need to store information about. They're the "nouns" in your system—the people, places, things, or even events that are absolutely central to what you're trying to build. In an ER diagram, we show entities as simple rectangles.
Let's imagine you’re designing a database for a university. What are the key things you'd need to track? Your main entities would probably be:
- Student: Representing each individual person enrolled.
- Course: Representing the subjects students can study.
- Instructor: Representing the academic staff teaching the courses.
Each of these is a distinct concept you need to capture data about. Pinning down these core subjects is always the first job when you start diagramming.
Attributes: The Details That Matter
If entities are the nouns, then attributes are the adjectives. They are the properties or characteristics that describe an entity, giving you the specific details that make each one unique. You can just think of them as the columns in a spreadsheet.
Sticking with our university example, the Student entity would need attributes like:
StudentIDFirstNameLastNameDateOfBirth
Similarly, the Course entity would have attributes like CourseCode, CourseTitle, and Credits. Each attribute defines a single, crucial piece of information we need to know. Without attributes, your entities are just empty boxes with no real-world detail.
Relationships: The Verbs That Connect Everything
Relationships are the glue holding it all together—the "verbs" that show how entities actually interact with one another. They bring the diagram to life by drawing the logical lines between different parts of your data model.
A relationship describes an association, like how a student enrolls in a course, or an instructor teaches a course. These connections are what turn a simple list of things into a coherent system, defining the business rules that make your data work.
The real power of an ER diagram isn't just in listing what data you have. It's in clearly mapping out how it all works together to support an actual business process. That’s where the magic happens.
Cardinality: The Rules of Engagement
Finally, cardinality is all about defining the numerical nature of a relationship. It gets specific about how many instances of one entity can be linked to instances of another. In short, it sets the ground rules for every connection.
You'll mainly come across three types of cardinality:
- One-to-One (1:1): One instance of an entity is tied to exactly one instance of another. A simple example might be a university dean being assigned to manage exactly one faculty.
- One-to-Many (1:N): This is very common. One instance of an entity can be associated with many instances of another. For example, an
Instructorcan teach manyCourses, but aCourseis only taught by oneInstructor. - Many-to-Many (M:N): Many instances of an entity can relate to many instances of another. A
Studentcan enroll in manyCourses, and at the same time, aCoursewill have manyStudentsenrolled in it.
Getting a firm grasp of these building blocks is the key to creating ER diagrams that lead to logical, efficient, and well-structured databases.
Decoding ERD Notations and Symbols

Think of ERD notations as different dialects of the same visual language. While they all aim to map out your database structure, they use distinct symbols and styles to get the message across. Understanding these dialects is the key to reading any ERD with confidence and, just as importantly, choosing the right one for your project.
The two most common notations you'll bump into are Chen notation and Crow's Foot notation. Each has its own strengths and is often preferred for different stages of the design process. Let's break them down.
Chen Notation: The Conceptual Blueprint
First up is Chen notation, developed by Peter Chen. This one is highly detailed and conceptual. It uses specific shapes for every single component—rectangles for entities, ovals for attributes, and diamonds for relationships.
This explicit separation makes it fantastic for high-level modelling where clarity and academic precision are the top priorities. You're painting the big picture here.
Crow's Foot Notation: The Developer's Choice
On the other hand, you have Crow's Foot notation. This style is far more common in practical, day-to-day development environments, especially within the fast-paced UK tech sector. Why? Because it’s pragmatic.
Its symbols are more compact and are drawn right onto the connector lines. This makes diagrams quicker to create and much easier to read when things get complex. It’s a favourite for developers building high-performance mobile apps with top-tier frameworks like Flutter, as it provides a clear, implementation-focused view.
Choosing Your Notation Style
So, how do you decide which to use? It’s not about which is “better,” but which is right for the job at hand.
Chen notation is your best friend during the initial brainstorming and conceptual design phases. Its detailed, academic style is perfect for making sure business stakeholders and data architects are perfectly aligned on the core concepts, without getting bogged down in technical implementation details.
Conversely, Crow's Foot notation shines when you move into the logical and physical design stages. Its symbols for cardinality (like the literal "crow's foot" for a "many" relationship) are incredibly intuitive and take up less space. The result is a cleaner diagram that maps more directly to an actual database schema. For a developer team in the UK, this is almost always the go-to choice for its sheer practicality and efficiency.
The choice isn't about which notation is "better," but which is more fit for purpose. Use Chen for conceptual clarity with business teams and Crow's Foot for the practical blueprint handed to developers.
Comparing Chen and Crow's Foot Notation
To really see the difference, a side-by-side comparison helps. The table below breaks down how each notation represents the core components of an ERD.
Notice how Chen is more descriptive with separate shapes, while Crow's Foot is more compact, embedding information into the entity boxes and connector lines.
| Component | Chen Notation Symbol | Crow's Foot Notation Symbol | Description |
|---|---|---|---|
| Entity | A rectangle containing the entity's name. | A rectangle containing the entity's name, often with attributes listed below. | The main object or concept, like 'Customer' or 'Product'. |
| Attribute | An oval connected to its entity by a line. | Listed as text inside the entity's rectangle. | A property of an entity, such as 'customerName' or 'price'. |
| Relationship | A diamond containing a verb, connecting two entities. | A labelled line drawn directly between two entities. | How two entities are associated, like 'places' an 'Order'. |
| Cardinality | Numbers (1, N, M) written beside the lines connecting to the relationship diamond. | Specific symbols at the end of the relationship line (e.g., a circle for zero, a dash for one, a crow's foot for many). | Defines the numerical relationship between entities (e.g., one-to-many). |
Ultimately, both notations get you to the same place: a clear, well-structured database design. The path you take just depends on who you’re talking to and what stage of the project you're in.
From High-Level Idea to Final Blueprint
Creating an ERD isn’t a one-and-done task. It’s a structured journey that carefully transforms a broad business idea into a detailed, ready-to-build database plan. This process unfolds across three distinct models, each layering on more detail and nudging the concept closer to technical reality.
Think of it like designing a new house. You start with a simple sketch of the rooms, then create detailed architectural drawings with measurements, and finally, you produce the construction blueprints for the builders.
This progressive approach makes sure the final database isn't just technically sound, but that it actually solves the business problems it’s meant to. Each stage serves a clear purpose and speaks to different people—from project managers trying to grasp the scope to the developers who will eventually write the code. This structured workflow is a cornerstone of the modern mobile app development process, ensuring everything is built on a solid foundation.
The Conceptual Model: The Big Picture
First up is the Conceptual Model. This is the 30,000-foot view of your data, focusing purely on what the business needs. At this point, we’re not getting bogged down with database systems or technical jargon like data types. We're simply identifying the main things—the entities—and how they connect.
For instance, a conceptual model for an e-commerce app would show entities like Customer, Product, and Order. It would also show the basic relationships between them, such as a Customer places an Order. Its main job is to get developers and business stakeholders on the same page, making sure everyone agrees on the core logic before a single line of code is written.
The Conceptual Model is your strategic starting point. It's all about understanding the 'what' and 'why' of the data, not the 'how'. It ensures the project's foundation is aligned with real-world business needs.
This infographic neatly shows the simple, foundational steps involved in these initial stages of diagramming.
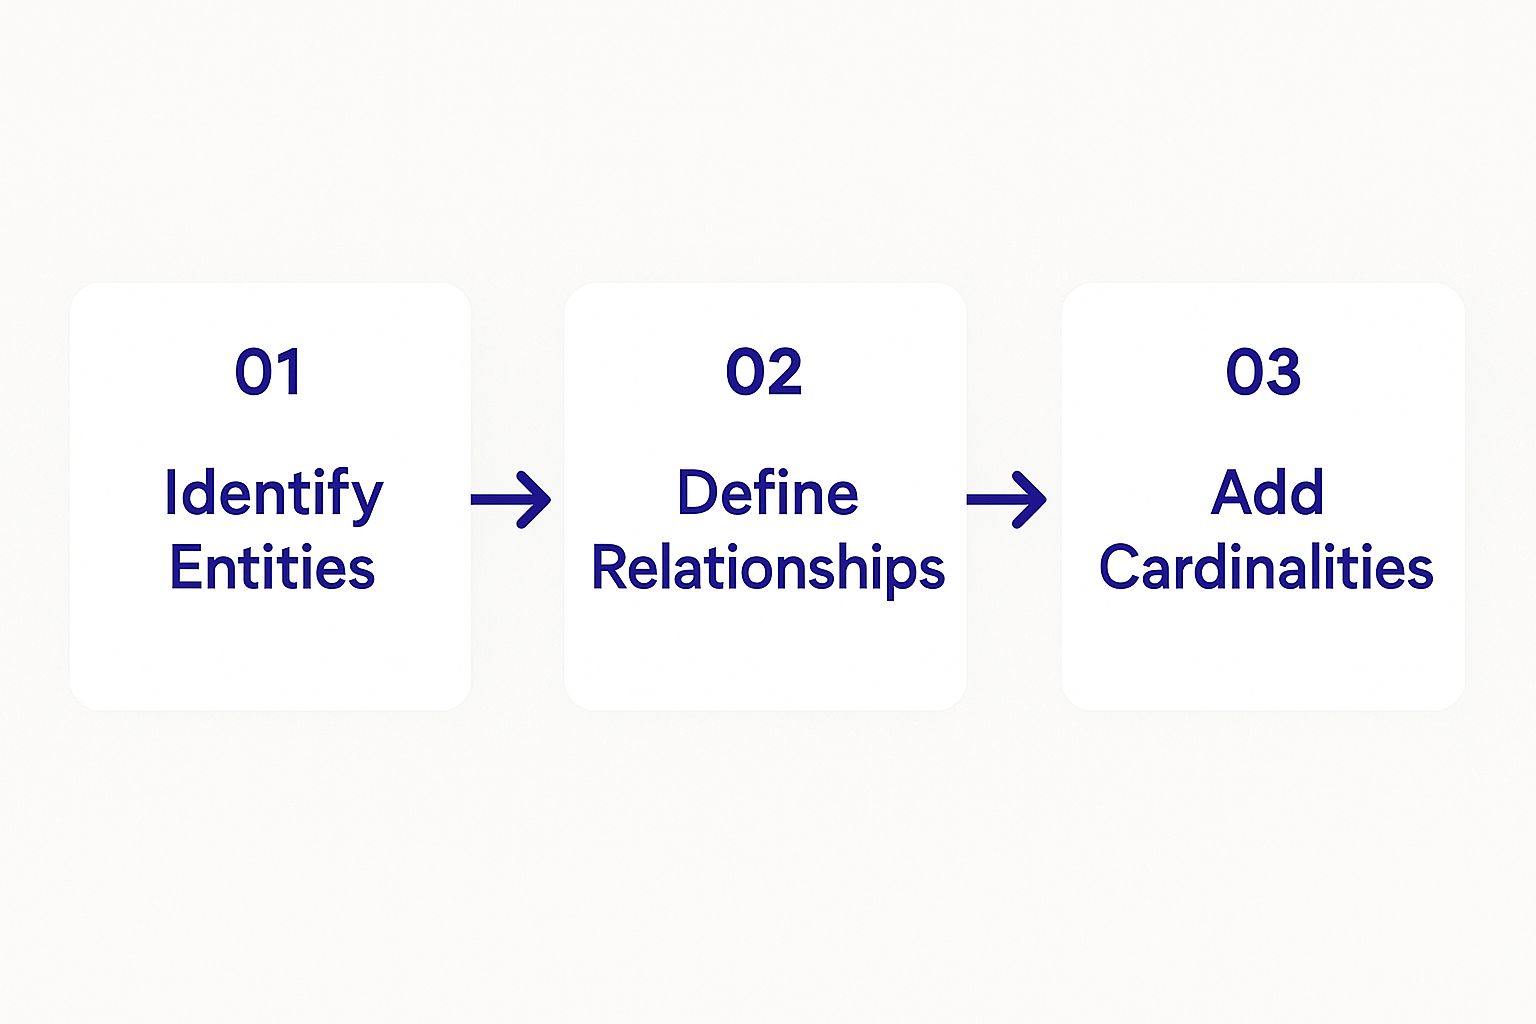
As the visual flow shows, it all starts with identifying the core entities. The next step is defining how they interact, which is exactly what the conceptual model achieves.
The Logical Model: Adding the Detail
With the big picture agreed upon, we move to the Logical Model. Here, we start adding more substance to our initial sketch. This model introduces attributes for each entity—think of these as the details, like a Customer having a name and email address. It also brings in primary and foreign keys to formally lock in the relationships.
Crucially, the logical model remains independent of any specific database management system (DBMS). It defines the structure of the data—what columns exist, what keys link them—without tying you to a particular technology like PostgreSQL, MySQL, or SQL Server. This flexibility makes it a powerful blueprint that can be adapted for various platforms down the line.
The Physical Model: The Final Blueprint
Finally, we arrive at the Physical Model. This is the most detailed and technical stage, representing the actual construction blueprint for a specific database. It takes the logical model and translates it into a concrete, ready-to-build plan.
This is where all the technical specifics come in. We define everything from column data types (e.g., VARCHAR, INT, TIMESTAMP) and specific constraints to indexes that will help the database run quickly. The physical model is tied to a chosen DBMS, reflecting its unique syntax and features. This is the diagram developers use to write the SQL code that brings the database tables to life, turning an abstract design into a tangible, working system.
How ERDs Power UK Business Systems

Let's move beyond the theory. The reality is that entity relationship diagramming is the unsung hero behind countless robust business systems right across the United Kingdom.
From bustling e-commerce platforms to critical NHS services, a well-crafted ERD is the structural backbone that allows complex software to function reliably. It’s the strategic blueprint that transforms a business vision into a functional, real-world system.
Real-World Examples in the UK
Imagine a national online retailer based in Manchester. Their entire operation hinges on a database that can flawlessly manage hundreds of thousands of products, customer accounts, and daily orders. An ERD is the very first step in designing this system. It visually maps out how a Customer relates to an Order, how an Order contains multiple Products, and how those Products are tracked in Inventory. This clarity prevents costly errors down the line and ensures the final system is both scalable and dependable.
Or think about a healthcare provider managing sensitive patient information. An ERD for their system would meticulously define the critical relationships between Patients, Appointments, Doctors, and MedicalRecords. This foundational blueprint is essential for maintaining data integrity, ensuring patient confidentiality, and building a system that medical staff can trust for accurate, instant information.
Driving Tangible Business Outcomes
The real value of entity relationship diagramming is its direct impact on a project's success. This isn't just a technical box-ticking exercise; it's a crucial business tool that delivers measurable results. Teams that invest time in creating clear ERDs at the start of a project see significant advantages throughout the entire development lifecycle.
The benefits are clear and compelling:
- Improved Data Integrity: ERDs enforce business rules at the database level, ensuring data stays consistent and trustworthy.
- Faster Development Cycles: By providing a clear plan, ERDs cut down on ambiguity and rework, letting developers build systems more quickly and with fewer mistakes.
- Enhanced Communication: They create a common visual language, getting developers, project managers, and business stakeholders on the same page about project goals.
An ERD translates complex business requirements into a logical, actionable plan. This alignment is critical for ensuring the final technology solution effectively solves the real-world problem it was designed for.
A Foundation for Modern Development
In the UK's competitive tech sector, efficiency is everything. Studies show that a huge majority—around 70%—of software development teams use ER modelling during the requirements gathering phase to improve clarity and reduce architectural mistakes. This simple practice has been directly linked to a reduction in development lifecycle delays by as much as 15-20%. You can dig deeper into data foundations in the UK private sector with this government-backed report.
This is especially true for mobile applications, where a well-structured backend database is non-negotiable. With new benchmarks confirming its elite status, building with a high-performance framework like Flutter is a strategic choice. The database's design directly impacts the app's speed and reliability. Understanding how to develop mobile apps with a solid data foundation is a key differentiator, and the principles of ERD modelling provide the stable groundwork needed for an exceptional user experience.
The Strategic Role of ERDs in AI and Transformation
In a world powered by data, it’s easy to think of an Entity Relationship Diagram (ERD) as just another technical tool for database designers. But that view misses the bigger picture. An ERD is a strategic asset, especially when it comes to game-changing initiatives like Artificial Intelligence (AI) and machine learning.
Think about it: AI and machine learning are only as good as the data they’re fed. For these advanced systems to work their magic, they need a clean, structured, and logical foundation. That’s exactly what entity relationship diagramming provides.
Without a coherent data model, AI algorithms are left trying to find patterns in chaos, which inevitably leads to wonky predictions and unreliable insights. A well-designed ERD is the architectural blueprint for a solid data warehouse. It ensures that your information is consistent, organised, and free from the messy structural problems that can completely derail an analytics project. For any UK organisation serious about using its data, this foundational work isn't just important—it's everything.
Enabling Advanced Analytics and AI
The link between a solid data structure and a successful AI rollout is direct and undeniable. A 2021 UK government-backed report highlighted that the actual design of datasets—where ERDs lay the groundwork—impacts the ability of nearly 65% of organisations to use AI effectively.
What's more, the report found that around 60% of organisations that nailed their data quality (a direct result of good diagramming) saw big improvements in how usable their data was. You can dig deeper into these findings on data foundations and their impact.
This structured approach is what allows businesses to build powerful analytical models. These models can do incredible things, like predict customer behaviour, streamline supply chains, or spot untapped market opportunities. It ensures that when you pull data from different systems, it all speaks the same language.
An ERD is the bedrock of data intelligence. It transforms scattered information into a structured asset, making it possible for AI and machine learning models to deliver meaningful, business-driving results.
This kind of strategic planning is central to modern software delivery. By mapping out data relationships clearly right from the start, development teams can build systems that are not only more resilient but also far more scalable down the line. Weaving these principles into your team's workflow is a key part of effective software development training, helping them sidestep common and costly mistakes. You can learn more about this philosophy in our guide on modern agile software training for UK teams.
Common Questions About ER Diagramming
As you start to get your hands dirty with entity relationship diagramming, a few practical questions almost always pop up. Sorting these out is key to bridging the gap between theory and what you actually do day-to-day.
One of the first hurdles is telling the difference between an ERD and a database schema. It’s a classic point of confusion. Think of it this way: an ERD is the high-level blueprint, the architect’s sketch. A schema, on the other hand, is the detailed construction plan, specifying every technical detail like data types and constraints.
Choosing the Right Tools
Another frequent topic is which notation works best for what job. When you’re building a mobile app, especially with a top-performing framework like Flutter, Crow’s Foot notation is usually the way to go. Its straightforward, compact style gives developers the practical details they need without getting lost in abstract symbols.
This focus on clarity is more important than ever. A 2023 UK government report highlighted that for 68% of organisations, getting clear system alignment—exactly what ERDs provide—was a vital step in adopting new technologies. That same report noted a whopping 45% jump in ERD-related training within large UK enterprises between 2020 and 2023. You can read the full breakdown in the government's report on technology adoption enablers for UK businesses.
A conceptual ERD should be kept simple. The goal is to identify major entities like 'User' or 'Product' and their relationships, leaving detailed attributes for the logical and physical models.
This progressive approach, starting simple and adding detail later, is what keeps everyone from stakeholders to developers on the same page throughout the project.
At App Developer UK, we build high-performance mobile applications on the solid foundation of well-designed data structures. Let our expert Flutter developers bring your vision to life. https://app-developer.uk